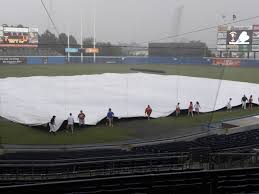
All posts by Caretaker

Portsmouth Sea Monsters 7, Norfolk Bluefish 5.

Bluefish Claws Back, But Falls Just Short Against Sea Monsters

July 1, 2017 – Virginia Beach, VA. 

Bluefish’s effort to come back from down five runs in the fifth inning came up just short, as they fell 7-5 to Sea Monsters on Saturday. Bluefish scored four runs in the failed comeback on a single by Spencer Muirhead in the fifth, a single by Michael Rojas in the eighth, a error in the ninth, and a error in the ninth.

Bluefish captured the lead in the first inning.  An error scored one run for Bluefish.

Sea Monsters knotted the game up at one in the top of the third inning. A wild pitch by Kevin Beckert scored one run for Sea Monsters.

Sea Monsters took the lead for good with two runs in the fourth inning. In the fourth Ricardo Carrasco singled off of Beckert, driving in one run and Andrew Godsey hit a sacrifice fly to drive in a run.

Sea Monsters scored three runs in the fifth inning. The big inning for Sea Monsters came thanks to a triple by Terrence Pinkston, a single by Hector Mosquea, and a walk by Godsey.

Tyghe Bowers earned the win for Sea Monsters. He went seven innings, giving up three runs, seven hits, striking out three, and walking one. Pinkston recorded the last six outs to earn the save for Sea Monsters. Beckert took the loss for Bluefish. He threw four and two-thirds innings, allowing six runs, eight hits, and striking out seven.

Bluefish collected nine hits. MacMilan Shoenman, Michael Rojas, Chadler Young, and Diggy Cimaroli each collected multiple hits for Bluefish. Spencer Muirhead and Rojas each drove in one run to lead Bluefish. Bluefish didn’t commit a single error in the field. Muirhead had nine chances in the field, the most on the team.

Godsey went 1-for-2 at the plate as he led the team with two runs batted in.

“Powered by Narrative Science and GameChanger Media. Copyright 2017. All rights reserved.” 

1 2 3 4 5 6 7 8 9 R H
MONS 0 0 1 2 3 0 0 0 1 7 11 4
BLFS 1 0 0 0 1 0 0 1 2 5 9 0

BOX SCORE

Portsmoth Sea Monsters
Lineup AB R H RBI BB K
Tyghe Bowers
Ricardo Carrasco 4 0 1 1 1 0
Andrew Godsey 2 1 1 2 1 0
Antonio Leite Jr. 5 0 1 0 0 2
Joe Lucas 4 1 4 1 1 0
Josh Mack 1 0 0 0 0 0
Hector Mosquea 5 1 1 1 0 2
Joshua Nellis 3 1 1 0 1 0
William Oliver 4 0 0 0 0 2
Terrence Pinkston 4 2 1 1 1 1
Lucas Terwilliger 5 1 1 0 0 2
Totals 37 7 11 6 5 9
Batting

3B: Joshua Nellis, Terrence Pinkston
TB: Ricardo Carrasco, Andrew Godsey, Antonio Leite Jr., Joe Lucas 4, Hector Mosquea, Joshua Nellis 3, Terrence Pinkston 3, Lucas Terwilliger
RBI: Ricardo Carrasco, Andrew Godsey 2, Joe Lucas, Hector Mosquea, Terrence Pinkston
SF: Andrew Godsey
HBP: Joshua Nellis
SB: Andrew Godsey, Terrence Pinkston

Totals

Team QAB: 20 (45.45%)
Ricardo Carrasco 3, Andrew Godsey 3, Antonio Leite Jr. 3, Joe Lucas 4, Joshua Nellis 3, William Oliver, Terrence Pinkston 2, Lucas Terwilliger

Team LOB: 10

Fielding

E: Antonio Leite Jr., Joe Lucas, Hector Mosquea, Lucas Terwilliger

Norfolk Bluefish
Lineup AB R H RBI BB K
Kevin Beckert
Kevin Edgar 2 0 0 0 0 0
Daniel Haskell 4 0 0 0 0 0
Noah Herried 5 1 0 0 0 2
Ashton Knutson
Spencer Muirhead 5 0 1 1 0 2
Michael Rojas 4 0 2 1 0 0
MacMilan Shoenman 5 2 2 0 0 0
Cody Steffey
Chadler Young 4 0 2 0 0 1
Delmarcus Talley 4 0 0 0 0 0
Alex Evans 1 1 0 0 1 0
Diggy Cimaroli 4 1 2 0 0 0
Totals 38 5 9 2 1 5
Batting

2B: Diggy Cimaroli
TB: Spencer Muirhead, Michael Rojas 2, MacMilan Shoenman 2, Chadler Young 2, Diggy Cimaroli 3
RBI: Spencer Muirhead, Michael Rojas
ROE: Noah Herried, Michael Rojas, Alex Evans
FC: Daniel Haskell, Delmarcus Talley
HBP: Kevin Edgar
SB: MacMilan Shoenman 2
PIK: Kevin Edgar

Totals

Team QAB: 17 (42.50%)
Kevin Edgar 2, Noah Herried 2, Spencer Muirhead 2, Michael Rojas 2, MacMilan Shoenman 2, Chadler Young 3, Alex Evans, Diggy Cimaroli 3

Team LOB: 8

.
Portsmoth Sea Monsters
Pitching IP #P S% H R ER K BB HR
Tyghe Bowers 7.0 105 .610 7 3 2 3 1 0
Terrence Pinkston 2.0 32 .594 2 2 0 2 0 0
Totals 9.0 137 .606 9 5 2 5 1 0
Pitching

W: Tyghe Bowers
SV: Terrence Pinkston
HBP: Tyghe Bowers
WP: Tyghe Bowers 3
Pitches-Strikes: Tyghe Bowers 105-64, Terrence Pinkston 32-19
Groundouts-Flyouts: Tyghe Bowers 3-12, Terrence Pinkston 0-3
First pitch strikes-Batters faced: Tyghe Bowers 19-30, Terrence Pinkston 6-10

.

Norfolk Bluefish
Pitching IP #P S% H R ER K BB HR
Kevin Beckert 4.2 99 .566 8 6 6 7 4 0
Ashton Knutson 3.1 37 .811 2 0 0 1 0 0
Cody Steffey 1.0 17 .412 1 1 1 1 1 0
Totals 9.0 153 .608 11 7 7 9 5 0
Pitching

L: Kevin Beckert
HBP: Kevin Beckert
WP: Kevin Beckert 2
Pitches-Strikes: Kevin Beckert 99-56, Ashton Knutson 37-30, Cody Steffey 17-7
Groundouts-Flyouts: Kevin Beckert 4-3, Ashton Knutson 5-4, Cody Steffey 1-1
First pitch strikes-Batters faced: Kevin Beckert 11-27, Ashton Knutson 12-12, Cody Steffey 1-5

Key
  • AB: At bats
  • R: Runs scored
  • H: Hits
  • RBI: Runs batted in
  • BB: Base on balls (walks)
  • K: Strikeouts
  • 2B: Doubles
  • 3B: Triples
  • HR: Home runs
  • Grand slam: Grand slam home runs
  • TB: Total bases
  • RBI: Runs batted in
  • SAC: Sacrifice hits & bunts
  • SF: Sacrifice flies
  • ROE: Reached on error
  • FC: Hit into fielder’s choice
  • HBP: Hit by pitch
  • CI: Batter advances on catcher’s interference
  • GIDP: Hit into double play
  • GITP: Hit into triple play
  • SB: Stolen bases
  • CS: Caught stealing
  • PIK: Picked off
  • QAB: Quality at bats (any one of: 3 pitches after 2 strikes, 6+ pitch ABs, XBH, HHB, BB, SAC Bunt, SAC Fly)
  • QAB%: Quality at bats per plate appearance
  • LOB: Runners left on base at the end of an inning
  • E: Errors
  • DP: Double Plays
  • TP: Triple Plays
  • IP: Innings Pitched
  • #P: Total pitches
  • S%: Strike percentage
  • H: Hits allowed
  • R: Runs allowed
  • ER: Earned runs allowed
  • K: Strikeouts
  • BB: Base on balls (walks)
  • HR: Home runs allowed
  • W: Wins
  • L: Losses
  • SV: Saves
  • BS: Blown saves
  • HBP: Hit batters
  • WP: Wild pitches
  • BK: Balks

Suffolk Fightin’ Crabs 11, Lynnhaven Pelicans 8.

Fightin’ Crabs Defeats Pelicans Despite Allowing 5-Run Inning

July 1, 2017- Virginia Beach, VA

Even though Fightin’ Crabs gave up five runs in the second inning, it still defeated Pelicans 11-8 on Saturday. Pelicans’s big inning was driven by a single by Pat Downey and a double by Harrison Sabo.

Fightin’ Crabs collected 13 hits and Pelicans had nine in the high-scoring affair

Pelicans took an early lead in the second inning. Pat Downey singled on a 1-0 count in the second inning, scoring one run.

Fightin’ Crabs took the lead for good with five runs in the fifth inning. In the fifth Zachary Blaeserdoubled off of Cody Burnham, driving in one run, Will Sheats singled off of Burnham, driving in one run, John Tierney Jr. singled off of Burnham, driving in two runs, and Burnham uncorked a wild pitch, scoring one run.

Jake Thompson earned the win for Fightin’ Crabs. He threw four and two-thirds innings, giving up zero runs, three hits, and walking one. Burnham took the loss for Pelicans. He went five innings, surrendering nine runs, 11 hits, striking out six, and walking zero.

Noah Gear started the game for Fightin’ Crabs. He threw four and a third innings, allowing eight runs, six hits, and striking out four.

Ben MacDonald, TJ Wardwell, Sheats, Tierney Jr., and Joseph Holguin each collected multiple hits for Fightin’ Crabs. Tierney Jr. led Fightin’ Crabs with two runs batted in. He went 2-for-5 on the day.

Harrison Sabo and Downey each collected multiple hits for Pelicans. Sabo led Pelicans with three hits in five at bats.

“Powered by Narrative Science and GameChanger Media. Copyright 2017. All rights reserved.” 

1 2 3 4 5 6 7 8 9 r h
PLCN 0 5 0 0 3 0 0 0 0 8 9 4
CRBS 0 1 2 1 5 0 2 0 X 11 13 5

BOX SCORE

Lynnhaven Pelicans
Lineup AB R H RBI BB K
Justin Hayes 2 1 1 0 3 0
Michael Diodato 4 0 0 0 0 2
Harrison Sabo 5 1 3 3 0 1
Josh Crummer 5 1 1 0 0 0
Tom Kelley 5 1 1 0 0 1
Justin Burrell 3 2 0 0 1 0
Pat Downey 4 1 2 1 0 0
Casey Turner 1 1 1 1 2 0
Chayton Lukkes 1 0 0 0 0 0
Tyler Jones 2 0 0 1 0 0
Cody Burnham
Chance Harvey
Santino Paris
Totals 32 8 9 6 6 4
Batting

2B: Pat Downey, Harrison Sabo
TB: Josh Crummer, Pat Downey 3, Justin Hayes, Tom Kelley, Harrison Sabo 4, Casey Turner
RBI: Pat Downey, Tyler Jones, Harrison Sabo 3, Casey Turner
SAC: Michael Diodato
SF: Tyler Jones
ROE: Justin Burrell 2, Tom Kelley
HBP: Tyler Jones
GIDP: Tyler Jones
SB: Justin Hayes 2, Tom Kelley

Totals

Team QAB: 22 (53.66%)
Justin Burrell 2, Michael Diodato 3, Pat Downey 3, Justin Hayes 5, Tyler Jones 2, Tom Kelley, Harrison Sabo 4, Casey Turner 2

Team LOB: 6

Fielding

E: Justin Burrell, Michael Diodato, Tom Kelley, Santino Paris

.
Suffolk Fightin’ Crabs
Lineup AB R H RBI BB K
John Tierney Jr. 5 1 2 2 0 2
Billy Buscetto 3 1 1 1 1 0
Sam Graf 5 0 0 0 0 0
Evan Hirschbaum 5 0 0 0 0 0
Ben MacDonald 4 2 3 1 1 0
Zachary Blaeser 5 1 1 1 0 1
TJ Wardwell 5 2 2 1 0 1
Will Sheats 4 2 2 1 0 2
Joseph Holguin 3 2 2 1 0 0
Noah Gear
Jake Thompson
Totals 39 11 13 8 2 6
Batting

2B: Ben MacDonald, Zachary Blaeser
3B: Ben MacDonald
TB: Billy Buscetto, Ben MacDonald 6, John Tierney Jr. 2, Zachary Blaeser 2, Joseph Holguin 2, Will Sheats 2, TJ Wardwell 2
RBI: Billy Buscetto, Ben MacDonald, John Tierney Jr. 2, Zachary Blaeser, Joseph Holguin, Will Sheats, TJ Wardwell
ROE: Evan Hirschbaum, TJ Wardwell
FC: Sam Graf, Zachary Blaeser
HBP: Billy Buscetto, Joseph Holguin
SB: Billy Buscetto, John Tierney Jr., Joseph Holguin 2

Totals

Team QAB: 15 (34.88%)
Billy Buscetto 3, Ben MacDonald 5, Sam Graf, Zachary Blaeser, Joseph Holguin, Will Sheats, TJ Wardwell 3

Team LOB: 8

Fielding

E: John Tierney Jr., Joseph Holguin 2, TJ Wardwell 2
DP: Ben MacDonald, John Tierney Jr., Noah Gear, Evan Hirschbaum, Will Sheats 3, TJ Wardwell

.
Lynnhaven Pelicans
Pitching IP #P S% H R ER K BB HR
Cody Burnham 5.0 100 .670 11 9 7 6 0 0
Santino Paris 1.1 34 .529 2 2 1 0 2 0
Chance Harvey 1.2 19 .526 0 0 0 0 0 0
Totals 8.0 153 .621 13 11 8 6 2 0
Pitching

L: Cody Burnham
HBP: Cody Burnham 2
WP: Cody Burnham
Pitches-Strikes: Cody Burnham 100-67, Chance Harvey 19-10, Santino Paris 34-18
Groundouts-Flyouts: Cody Burnham 5-3, Chance Harvey 2-3, Santino Paris 0-3
First pitch strikes-Batters faced: Cody Burnham 17-29, Chance Harvey 1-5, Santino Paris 5-9

.

Suffolk Fightin’ Crabs
Pitching IP #P S% H R ER K BB HR
Noah Gear 4.1 100 .550 6 8 3 4 5 0
Jake Thompson 4.2 44 .659 3 0 0 0 1 0
Totals 9.0 144 .583 9 8 3 4 6 0
Pitching

W: Jake Thompson
HBP: Jake Thompson
Pitches-Strikes: Noah Gear 100-55, Jake Thompson 44-29
Groundouts-Flyouts: Noah Gear 2-4, Jake Thompson 3-9
First pitch strikes-Batters faced: Noah Gear 14-24, Jake Thompson 13-17

Key
  • AB: At bats
  • R: Runs scored
  • H: Hits
  • RBI: Runs batted in
  • BB: Base on balls (walks)
  • K: Strikeouts
  • 2B: Doubles
  • 3B: Triples
  • HR: Home runs
  • Grand slam: Grand slam home runs
  • TB: Total bases
  • RBI: Runs batted in
  • SAC: Sacrifice hits & bunts
  • SF: Sacrifice flies
  • ROE: Reached on error
  • FC: Hit into fielder’s choice
  • HBP: Hit by pitch
  • CI: Batter advances on catcher’s interference
  • GIDP: Hit into double play
  • GITP: Hit into triple play
  • SB: Stolen bases
  • CS: Caught stealing
  • PIK: Picked off
  • QAB: Quality at bats (any one of: 3 pitches after 2 strikes, 6+ pitch ABs, XBH, HHB, BB, SAC Bunt, SAC Fly)
  • QAB%: Quality at bats per plate appearance
  • LOB: Runners left on base at the end of an inning
  • E: Errors
  • DP: Double Plays
  • TP: Triple Plays
  • IP: Innings Pitched
  • #P: Total pitches
  • S%: Strike percentage
  • H: Hits allowed
  • R: Runs allowed
  • ER: Earned runs allowed
  • K: Strikeouts
  • BB: Base on balls (walks)
  • HR: Home runs allowed
  • W: Wins
  • L: Losses
  • SV: Saves
  • BS: Blown saves
  • HBP: Hit batters
  • WP: Wild pitches
  • BK: Balks

Cheasapeake Suns 13, Virginia Beach Waves 8.

Suns Jumps Out To Early Lead In Victory Over Waves

July 1, 2017 – Virginia Beach, VA. 

Suns jumped out to an early lead over Waves and took home a 13-8 victory on Saturday. Suns scored on a single by Jamarius Epperson in the first inning, a triple by Harris in the first inning, a triple by Justice Bigbie in the first inning, a single in the first inning, a walk in the second inning, and a error in the second inning.

Both offenses were strong at the plate as Suns collected 16 hits and Waves 17. Waves captured the lead in the first inning. Waves scored one run when Matt Padeway singled with one out in the first inning.

After Waves scored two runs in the top of the sixth, Suns answered with two of their own.Waves scored when Brandon Kussmaul grounded out, scoring one run and Jonathan Lindausingled off of Justin Borges, driving in one run. Suns then answered when Andrew Rodriguez singled off of Collin Porter, driving in one run and Porter walked Jamarius Epperson to drive in a run.

Suns took the lead for good with four runs in the first inning. In the first Epperson singled off of Chance Pauley, driving in one run, Harris tripled off of Pauley, driving in one run, Justice Bigbie tripled off of Pauley, driving in one run, and Pauley uncorked a wild pitch, scoring one run.

Ryan Riley earned the win for Suns. He tossed five innings, allowing four runs, nine hits, and striking out six. Borges threw two innings, as three relievers helped Suns finish off the victory.Pauley took the loss for Waves. He pitched five innings, giving up nine runs, 12 hits, and striking out three.

Epperson, Tynan Hoefferle, Jarad Clevenger, Tyler Dean, Bigbie, and Harris each collected multiple hits for Suns. Epperson went 3-for-5 at the plate as he led the team with three runs batted in. Suns didn’t commit a single error in the field. Hoefferle had the most chances in the field with seven.

Ross Abrash, Kevin Roberts, Colin Mattice, Jacob Day, Chandler Sulcer, and Padeway each collected multiple hits for Waves.

“Powered by Narrative Science and GameChanger Media. Copyright 2017. All rights reserved.” 

1 2 3 4 5 6 7 8 9 r h
WVS 1 0 0 1 0 2 0 2 2 8 17 4
SUNS 4 2 1 0 2 2 2 0 X 13 16 0

BOX SCORE

Virginia Beach Waves
Lineup AB R H RBI BB K
Ross Abrash 6 3 3 1 0 0
Brandon Kussmaul 5 0 0 1 1 2
Matt Padeway 2 0 2 1 1 0
Jonathan Lindau 1 0 1 2 0 0
Thomas Meucci 4 0 1 0 1 1
Jacob Day 5 2 2 0 0 2
Kevin Roberts 5 0 3 0 0 1
Collin Porter 3 0 0 0 0 0
Samuel Czel 1 0 1 0 0 0
Jackson Posnik 1 0 0 0 0 0
Colin Mattice 4 2 2 0 1 0
Chandler Sulcer 3 1 2 1 2 1
Chance Pauley
Totals 40 8 17 6 6 7
Batting

2B: Ross Abrash
3B: Samuel Czel
TB: Colin Mattice 2, Jonathan Lindau, Ross Abrash 4, Samuel Czel 3, Jacob Day 2, Thomas Meucci, Kevin Roberts 3, Chandler Sulcer 2, Matt Padeway 2
RBI: Brandon Kussmaul, Jonathan Lindau 2, Ross Abrash, Chandler Sulcer, Matt Padeway
SF: Jonathan Lindau
FC: Ross Abrash
GIDP: Collin Porter, Jackson Posnik
SB: Matt Padeway

Totals

Team QAB: 24 (51.06%)
Colin Mattice 3, Brandon Kussmaul, Jonathan Lindau 2, Ross Abrash 4, Samuel Czel, Jacob Day, Thomas Meucci 4, Kevin Roberts, Chandler Sulcer 5, Matt Padeway 2

Team LOB: 12

Fielding

E: Brandon Kussmaul, Jacob Day, Thomas Meucci, Chance Pauley
DP: Brandon Kussmaul, Jacob Day

Chesapeake Suns
Lineup AB R H RBI BB K
Jarad Clevenger 4 2 2 1 1 0
Ben Marsico 1 0 0 0 0 0
Jamarius Epperson 5 3 3 3 1 1
Harris 5 1 2 2 1 1
Justice Bigbie 5 2 2 2 0 0
Michael Parmely 0 0 0 0 1 0
Tynan Hoefferle 5 1 2 1 0 1
Michael Perlo 3 0 0 0 1 1
Brad Pearson 1 0 0 1 0 0
Lawrence Cicileo 4 1 1 0 1 1
Corey King 4 2 1 0 1 1
Tyler Dean 2 1 2 0 1 0
Andrew Rodriguez 2 0 1 1 0 0
Justin Borges
Justin Bunting
Cameron Jensen
Meigs Lamb
Lane Madsen
Ryan Riley
Austin Thomas
Totals 41 13 16 11 8 6
Batting

2B: Tyler Dean
3B: Justice Bigbie, Harris, Tynan Hoefferle
TB: Justice Bigbie 4, Lawrence Cicileo, Jarad Clevenger 2, Tyler Dean 3, Jamarius Epperson 3, Harris 4, Tynan Hoefferle 4, Corey King, Andrew Rodriguez
RBI: Justice Bigbie 2, Jarad Clevenger, Jamarius Epperson 3, Harris 2, Tynan Hoefferle, Brad Pearson, Andrew Rodriguez
ROE: Justice Bigbie, Jarad Clevenger
FC: Jarad Clevenger
HBP: Tynan Hoefferle
GIDP: Michael Perlo
SB: Corey King
CS: Jarad Clevenger

Totals

Team QAB: 22 (44.00%)
Justice Bigbie 2, Lawrence Cicileo 2, Jarad Clevenger 3, Tyler Dean 2, Jamarius Epperson 4, Harris 3, Tynan Hoefferle 2, Corey King 2, Michael Parmely, Michael Perlo

Team LOB: 13

Fielding

DP: Justin Bunting, Jarad Clevenger, Tyler Dean, Harris, Tynan Hoefferle 3, Brad Pearson, Andrew Rodriguez 2

.
Virginia Beach Waves
Pitching IP #P S% H R ER K BB HR
Chance Pauley 5.0 106 .651 12 9 7 3 3 0
Collin Porter 0.2 30 .567 2 2 0 1 2 0
Samuel Czel 0.2 17 .412 2 2 2 0 2 0
Brandon Kussmaul 1.2 25 .560 0 0 0 2 1 0
Totals 8.0 178 .601 16 13 9 6 8 0
Pitching

L: Chance Pauley
HBP: Chance Pauley
WP: Chance Pauley 2
Pitches-Strikes: Brandon Kussmaul 25-14, Samuel Czel 17-7, Chance Pauley 106-69, Collin Porter 30-17
Groundouts-Flyouts: Brandon Kussmaul 2-1, Samuel Czel 1-1, Chance Pauley 7-2, Collin Porter 1-1
First pitch strikes-Batters faced: Brandon Kussmaul 3-6, Samuel Czel 3-6, Chance Pauley 21-31, Collin Porter 4-7

Chesapeake Suns
Pitching IP #P S% H R ER K BB HR
Ryan Riley 5.0 101 .584 9 4 4 6 4 0
Justin Borges 2.0 33 .758 2 0 0 0 0 0
Lane Madsen 1.0 21 .476 2 2 2 0 1 0
Meigs Lamb 1.0 29 .483 4 2 1 1 1 0
Totals 9.0 184 .587 17 8 7 7 6 0
Pitching

W: Ryan Riley
WP: Lane Madsen
Pitches-Strikes: Justin Borges 33-25, Meigs Lamb 29-14, Lane Madsen 21-10, Ryan Riley 101-59
Groundouts-Flyouts: Justin Borges 2-3, Meigs Lamb 1-0, Lane Madsen 0-2, Ryan Riley 4-4
First pitch strikes-Batters faced: Justin Borges 7-8, Meigs Lamb 1-7, Lane Madsen 1-5, Ryan Riley 11-27

Key
  • AB: At bats
  • R: Runs scored
  • H: Hits
  • RBI: Runs batted in
  • BB: Base on balls (walks)
  • K: Strikeouts
  • 2B: Doubles
  • 3B: Triples
  • HR: Home runs
  • Grand slam: Grand slam home runs
  • TB: Total bases
  • RBI: Runs batted in
  • SAC: Sacrifice hits & bunts
  • SF: Sacrifice flies
  • ROE: Reached on error
  • FC: Hit into fielder’s choice
  • HBP: Hit by pitch
  • CI: Batter advances on catcher’s interference
  • GIDP: Hit into double play
  • GITP: Hit into triple play
  • SB: Stolen bases
  • CS: Caught stealing
  • PIK: Picked off
  • QAB: Quality at bats (any one of: 3 pitches after 2 strikes, 6+ pitch ABs, XBH, HHB, BB, SAC Bunt, SAC Fly)
  • QAB%: Quality at bats per plate appearance
  • LOB: Runners left on base at the end of an inning
  • E: Errors
  • DP: Double Plays
  • TP: Triple Plays
  • IP: Innings Pitched
  • #P: Total pitches
  • S%: Strike percentage
  • H: Hits allowed
  • R: Runs allowed
  • ER: Earned runs allowed
  • K: Strikeouts
  • BB: Base on balls (walks)
  • HR: Home runs allowed
  • W: Wins
  • L: Losses
  • SV: Saves
  • BS: Blown saves
  • HBP: Hit batters
  • WP: Wild pitches
  • BK: Balks

Outer Banks Daredevils 4, Portsmouth Sea Monsters 0.

Two Pitchers Team Up As Daredevils Shuts Out Sea Monsters

June 30, 2017 – Kill Devil Hills, NC.

Daredevils defeated Sea Monsters 4-0 on Friday as two pitchers combined to throw a shutout. Payton Holdsworth induced a groundout from Corbin Townsend to finish off the game.

An early lead helped propel Daredevils to victory. Daredevils scored on a walk by Derek Hortonand an error in the second inning.

Daredevils captured the lead in the second inning. Horton drove in a run when he walked with the bases loaded.

A single by Corbin Townsend in the seventh inning was a positive for Sea Monsters.

Thomas Packert earned the win for Daredevils. He threw seven innings, giving up zero runs, one hit, and striking out eight. Payton Holdsworth recorded the last six outs to earn the save for Daredevils. Tyrin Everette took the loss for Sea Monsters. He went four and two-thirds innings, surrendering three runs, two hits, and striking out five.

Bubba Ruiz and Eli Straw all had one hit to lead Daredevils.

“Powered by Narrative Science and GameChanger Media. Copyright 2017. All rights reserved.” 

1 2 3 4 5 6 7 8 9 r h
MONS 0 0 0 0 0 0 0 0 0 0 2 3
DVLS 0 3 0 0 0 1 0 0 X 4 2 1

BOX SCORE

Portsmoth Sea Monsters
Lineup AB R H RBI BB K
Josh Mack 1 0 0 0 2 0
Hector Mosquea 1 0 0 0 0 0
Andrew Godsey 4 0 0 0 0 0
Terrence Pinkston 4 0 1 0 0 1
Joshua Nellis 3 0 0 0 0 1
Corbin Townsend 4 0 1 0 0 2
Lucas Terwilliger 3 0 0 0 0 1
Joe Lucas 3 0 0 0 0 3
Robert Saghy 1 0 0 0 0 0
Dwight Riddick 0 0 0 0 1 0
William Oliver 3 0 0 0 0 2
Tyrin Everette
Seth Houston
Totals 27 0 2 0 3 10
Batting

TB: Terrence Pinkston, Corbin Townsend
HBP: Joshua Nellis, Robert Saghy
GIDP: Andrew Godsey
SB: Josh Mack
PIK: Robert Saghy

Totals

Team QAB: 6 (18.75%)
Andrew Godsey, Josh Mack 2, William Oliver, Terrence Pinkston, Dwight Riddick

Team LOB: 5

Fielding

E: Josh Mack 2, William Oliver

.

Outer Banks Daredevils
Lineup AB R H RBI BB K
Damian Hairston 2 0 0 0 2 0
Josh Healy 1 0 0 0 0 1
Andrew Kasiski 4 0 0 1 0 0
Brent West 4 0 0 0 0 1
Eli Straw 2 0 1 0 2 0
Ryan Williams 2 1 0 0 1 1
Bubba Ruiz 2 0 1 0 1 1
Julio Rosales 4 1 0 0 0 3
Craig McLane 2 2 0 0 1 2
Derek Horton 3 0 0 1 1 2
Thomas Packert
Payton Holdsworth
Totals 26 4 2 2 8 11
Batting

2B: Eli Straw
TB: Bubba Ruiz, Eli Straw 2
RBI: Andrew Kasiski, Derek Horton
SAC: Bubba Ruiz
ROE: Andrew Kasiski, Julio Rosales
FC: Andrew Kasiski, Brent West
HBP: Ryan Williams, Craig McLane
CS: Eli Straw

Totals

Team QAB: 15 (40.54%)
Ryan Williams 2, Bubba Ruiz 2, Eli Straw 3, Damian Hairston 2, Derek Horton 2, Craig McLane 2, Brent West, Julio Rosales

Team LOB: 9

Fielding

E: Ryan Williams
DP: Thomas Packert

.
Portsmoth Sea Monsters
Pitching IP #P S% H R ER K BB HR
Tyrin Everette 4.2 97 .515 2 3 0 5 5 0
Seth Houston 3.1 50 .540 0 1 1 6 3 0
Totals 8.0 147 .524 2 4 1 11 8 0
Pitching

L: Tyrin Everette
HBP: Tyrin Everette, Seth Houston
WP: Seth Houston
Pitches-Strikes: Tyrin Everette 97-50, Seth Houston 50-27
Groundouts-Flyouts: Tyrin Everette 2-6, Seth Houston 0-2
First pitch strikes-Batters faced: Tyrin Everette 11-24, Seth Houston 5-13

Outer Banks Daredevils
Pitching IP #P S% H R ER K BB HR
Thomas Packert 7.0 86 .605 1 0 0 8 2 0
Payton Holdsworth 2.0 26 .769 1 0 0 2 1 0
Totals 9.0 112 .643 2 0 0 10 3 0
Pitching

W: Thomas Packert
SV: Payton Holdsworth
HBP: Thomas Packert 2
Pitches-Strikes: Thomas Packert 86-52, Payton Holdsworth 26-20
Groundouts-Flyouts: Thomas Packert 5-6, Payton Holdsworth 4-0
First pitch strikes-Batters faced: Thomas Packert 15-24, Payton Holdsworth 8-8

Key
  • AB: At bats
  • R: Runs scored
  • H: Hits
  • RBI: Runs batted in
  • BB: Base on balls (walks)
  • K: Strikeouts
  • 2B: Doubles
  • 3B: Triples
  • HR: Home runs
  • Grand slam: Grand slam home runs
  • TB: Total bases
  • RBI: Runs batted in
  • SAC: Sacrifice hits & bunts
  • SF: Sacrifice flies
  • ROE: Reached on error
  • FC: Hit into fielder’s choice
  • HBP: Hit by pitch
  • CI: Batter advances on catcher’s interference
  • GIDP: Hit into double play
  • GITP: Hit into triple play
  • SB: Stolen bases
  • CS: Caught stealing
  • PIK: Picked off
  • QAB: Quality at bats (any one of: 3 pitches after 2 strikes, 6+ pitch ABs, XBH, HHB, BB, SAC Bunt, SAC Fly)
  • QAB%: Quality at bats per plate appearance
  • LOB: Runners left on base at the end of an inning
  • E: Errors
  • DP: Double Plays
  • TP: Triple Plays
  • IP: Innings Pitched
  • #P: Total pitches
  • S%: Strike percentage
  • H: Hits allowed
  • R: Runs allowed
  • ER: Earned runs allowed
  • K: Strikeouts
  • BB: Base on balls (walks)
  • HR: Home runs allowed
  • W: Wins
  • L: Losses
  • SV: Saves
  • BS: Blown saves
  • HBP: Hit batters
  • WP: Wild pitches
  • BK: Balks

Suffolk Fightin’ Crabs 12, Tidewater Hawks 2.

Fightin’ Crabs Jumps Out To Early Lead In Victory Over Hawks

June 30, 2017 – Virginia Beach, VA

Fightin’ Crabs defeated Hawks 12-2 thanks to a strong start. Fightin’ Crabs scored on a groundout by Billy Buscetto in the first inning, a single by Brendan Gausselin in the second inning, a single by John Tierney Jr. in the second inning, a single by Sam Graf in the second inning, and a single by Evan Hirschbaum in the second inning.

Fightin’ Crabs captured the lead in the first inning. Billy Buscetto grounded out, scoring one run.

Fightin’ Crabs took the lead for good with four runs in the second inning. In the second Brendan Gausselin singled off of Ethan Santos, driving in one run, John Tierney Jr. singled off of Santos, driving in one run, Sam Graf singled off of Santos, driving in one run, and Evan Hirschbaumsingled off of Santos, driving in one run.

Fightin’ Crabs scored five runs in the seventh inning. Fightin’ Crabs scored on a single by Tierney Jr., a single by Graf, and a double by Hirschbaum.

Trevor Smith earned the win for Fightin’ Crabs. He went five innings, giving up two runs, six hits, striking out four, and walking one. Santos took the loss for Hawks. He pitched five innings, giving up five runs, seven hits, and striking out two.

Fightin’ Crabs collected 13 hits. Hirschbaum, Graf, and Tierney Jr. each collected multiple hits for Fightin’ Crabs. Hirschbaum, Tierney Jr., and Graf each drove in three runs to lead Fightin’ Crabs.

Hawks had nine hits in the game. Cameron Reckling and Ethan Reando each collected multiple hits for Hawks. Reckling went 3-for-4 at the plate as he led the team with two runs batted in.

“Powered by Narrative Science and GameChanger Media. Copyright 2017. All rights reserved.” 

1 2 3 4 5 6 7 8 9 r h
HWKS 0 1 0 1 0 0 0 X X 2 9 2
CRBS 1 4 0 0 0 2 5 X X 12 13 2

BOX SCORE

Tidewater Hawks
Lineup AB R H RBI BB K
Cameron Reckling 4 0 3 2 0 0
Tyler Dodson 4 0 1 0 0 0
Andre Marchesseault 2 0 0 0 0 0
Cullen Stockley 2 0 1 0 1 0
Dalton Jackson 4 0 0 0 0 2
Garrett Lyons 4 0 1 0 0 1
Shane Davis 4 1 0 0 0 1
Ethan Reando 2 1 2 0 0 0
Kevin Shaw 2 0 1 0 0 0
Andrew Teixeira 0 0 0 0 0 0
Jake Crumbly
Alex Dingman
Ben Mason
Ethan Santos
Totals 28 2 9 2 1 4
Batting

TB: Tyler Dodson, Garrett Lyons, Ethan Reando 2, Cameron Reckling 3, Kevin Shaw, Cullen Stockley
RBI: Cameron Reckling 2
SAC: Andre Marchesseault, Kevin Shaw
ROE: Shane Davis
FC: Tyler Dodson, Cameron Reckling, Kevin Shaw
HBP: Andre Marchesseault, Ethan Reando, Cullen Stockley
GIDP: Tyler Dodson
SB: Cameron Reckling

Totals

Team QAB: 15 (44.12%)
Shane Davis, Tyler Dodson 2, Garrett Lyons 2, Andre Marchesseault 2, Ethan Reando 2, Cameron Reckling 2, Kevin Shaw, Cullen Stockley 3

Team LOB: 11

Fielding

E: Dalton Jackson, Cullen Stockley

Suffolk Fightin’ Crabs
Lineup AB R H RBI BB K
John Tierney Jr. 5 3 3 3 0 1
Billy Buscetto 3 1 0 2 1 0
Sam Graf 5 1 3 3 0 1
Evan Hirschbaum 5 0 4 3 0 0
Kyle Kania 4 0 0 0 0 2
Ben MacDonald 3 1 0 0 1 0
Reilly Workman 3 1 1 0 1 0
Brendan Gausselin 2 3 1 1 2 0
TJ Wardwell 3 2 1 0 1 0
Trevor Smith
Jake Thompson
Totals 33 12 13 12 6 4
Batting

2B: Reilly Workman, Evan Hirschbaum
TB: Reilly Workman 2, Brendan Gausselin, John Tierney Jr. 3, Sam Graf 3, Evan Hirschbaum 5, TJ Wardwell
RBI: Billy Buscetto 2, Brendan Gausselin, John Tierney Jr. 3, Sam Graf 3, Evan Hirschbaum 3
SF: Billy Buscetto
ROE: Ben MacDonald 2
FC: Brendan Gausselin
SB: Ben MacDonald, John Tierney Jr., Sam Graf, Evan Hirschbaum

Totals

Team QAB: 23 (57.50%)
Billy Buscetto 4, Ben MacDonald 3, Reilly Workman 2, Kyle Kania, Brendan Gausselin 4, John Tierney Jr. 2, Sam Graf, Evan Hirschbaum 2, TJ Wardwell 4

Team LOB: 7

Fielding

E: John Tierney Jr., TJ Wardwell
DP: Billy Buscetto, Kyle Kania, John Tierney Jr.

.
Tidewater Hawks
Pitching IP #P S% H R ER K BB HR
Ethan Santos 5.0 105 .581 7 5 2 2 2 0
Ben Mason 0.2 29 .517 2 2 2 1 2 0
Jake Crumbly 1.0 35 .543 4 5 5 1 2 0
Garrett Lyons 0.0 0 .000 1 0 0 0 0 0
Totals 6.2 169 .562 14 12 9 4 6 0
Pitching

L: Ethan Santos
Pitches-Strikes: Jake Crumbly 35-19, Garrett Lyons 0-0, Ben Mason 29-15, Ethan Santos 105-61
Groundouts-Flyouts: Jake Crumbly 1-1, Garrett Lyons 0-0, Ben Mason 0-1, Ethan Santos 5-5
First pitch strikes-Batters faced: Jake Crumbly 7-9, Garrett Lyons 0-0, Ben Mason 3-6, Ethan Santos 17-25

Suffolk Fightin’ Crabs
Pitching IP #P S% H R ER K BB HR
Trevor Smith 5.0 100 .570 6 2 1 4 1 0
Jake Thompson 2.0 19 .632 3 0 0 0 0 0
Totals 7.0 119 .580 9 2 1 4 1 0
Pitching

W: Trevor Smith
HBP: Trevor Smith 3
Pitches-Strikes: Trevor Smith 100-57, Jake Thompson 19-12
Groundouts-Flyouts: Trevor Smith 4-5, Jake Thompson 1-3
First pitch strikes-Batters faced: Trevor Smith 13-25, Jake Thompson 5-9

Key
  • AB: At bats
  • R: Runs scored
  • H: Hits
  • RBI: Runs batted in
  • BB: Base on balls (walks)
  • K: Strikeouts
  • 2B: Doubles
  • 3B: Triples
  • HR: Home runs
  • Grand slam: Grand slam home runs
  • TB: Total bases
  • RBI: Runs batted in
  • SAC: Sacrifice hits & bunts
  • SF: Sacrifice flies
  • ROE: Reached on error
  • FC: Hit into fielder’s choice
  • HBP: Hit by pitch
  • CI: Batter advances on catcher’s interference
  • GIDP: Hit into double play
  • GITP: Hit into triple play
  • SB: Stolen bases
  • CS: Caught stealing
  • PIK: Picked off
  • QAB: Quality at bats (any one of: 3 pitches after 2 strikes, 6+ pitch ABs, XBH, HHB, BB, SAC Bunt, SAC Fly)
  • QAB%: Quality at bats per plate appearance
  • LOB: Runners left on base at the end of an inning
  • E: Errors
  • DP: Double Plays
  • TP: Triple Plays
  • IP: Innings Pitched
  • #P: Total pitches
  • S%: Strike percentage
  • H: Hits allowed
  • R: Runs allowed
  • ER: Earned runs allowed
  • K: Strikeouts
  • BB: Base on balls (walks)
  • HR: Home runs allowed
  • W: Wins
  • L: Losses
  • SV: Saves
  • BS: Blown saves
  • HBP: Hit batters
  • WP: Wild pitches
  • BK: Balks

Greenbrier Knights 10, Sandbridge Seagulls 2.

Seagulls Can’t Hold Up Against Knights

June 30, 2017 – Virginia Beach, VA

Seagulls couldn’t keep up with Knights and fell 10-2 on Friday.

Seagulls captured the lead in the first inning. Jonathan Santiago’s sac fly scored one run for Seagulls.

Knights took the lead for good with four runs in the third inning. In the third Chris Guillesdoubled off of Andrew Griffin, driving in two runs and Stephen Baughan singled off of Griffin, driving in two runs.

Teddy Herbert earned the win for Knights. He went six innings, surrendering two runs, six hits, and striking out eight. Baughan threw two innings, as two relievers helped Knights finish off the victory. Griffin took the loss for Seagulls. He pitched five innings, giving up eight runs, six hits, and striking out four.

Santiago and Grant Thompson each drove in one run to lead Seagulls.

Knights collected ten hits. Baughan and Chris Henderson each collected multiple hits for Knights.

“Powered by Narrative Science and GameChanger Media. Copyright 2017. All rights reserved.” 

1 2 3 4 5 6 7 8 9 r h
KNGT 0 0 4 0 2 3 1 0 0 10 10 1
GULS 1 1 0 0 0 0 0 0 0 2 6 2

BOX SCORE

Greenbrier Knights
Lineup AB R H RBI BB K
Samuel Neal 5 1 1 1 1 0
Chris Henderson 3 2 2 1 1 0
Chris Guilles 4 1 1 3 0 1
Stephen Baughan 5 0 2 2 0 0
Matt Polak 4 1 0 0 1 1
Jay Brandt 3 1 1 0 0 0
Robert Scott 2 0 1 0 0 0
Bennie Spady 3 1 1 0 0 2
Thomas Chisam 2 0 1 1 0 0
J Foster 3 0 0 0 0 1
Nick Lees 1 0 0 0 1 0
Bryce Jones 3 3 0 0 2 0
Teddy Herbert
Colin Ottofaro
Totals 38 10 10 8 6 5
Batting

2B: Thomas Chisam, Chris Guilles
TB: Jay Brandt, Robert Scott, Samuel Neal, Thomas Chisam 2, Chris Henderson 2, Bennie Spady, Stephen Baughan 2, Chris Guilles 2
RBI: Samuel Neal, Thomas Chisam, Chris Henderson, Stephen Baughan 2, Chris Guilles 3
SF: Chris Guilles
ROE: Bryce Jones, Stephen Baughan
FC: Samuel Neal, Stephen Baughan
HBP: Chris Henderson
SB: Robert Scott

Totals

Team QAB: 19 (41.30%)
Jay Brandt 2, Nick Lees 2, Samuel Neal 3, Bryce Jones 3, Thomas Chisam, Chris Henderson, Matt Polak, Bennie Spady 2, Stephen Baughan, Chris Guilles 2, J Foster

Team LOB: 9

Fielding

E: Bennie Spady

Sandbride Seagulls
Lineup AB R H RBI BB K
Andrew Poirier 2 1 1 0 0 0
Matt Van Muelken 2 0 0 0 0 2
Patrick Keohane 2 0 1 0 1 0
John Wicksier 1 0 0 0 0 1
Grant Thompson 3 0 3 1 0 0
Jordeyn Lewis 1 0 0 0 0 1
Tyler Young 3 0 0 0 0 1
Christopher Houle 1 0 0 0 0 0
Jonathan Santiago 3 0 1 1 0 0
Derrek Marshall Jr. 4 0 0 0 0 1
Shane Gipson 2 0 0 0 0 2
Christian Concepcion 2 0 0 0 0 2
Garrison Vick 3 1 0 0 1 1
Elijah Ervin 3 0 0 0 1 2
Andrew Griffin
Nicholas Palermo
Tyler Key
Totals 32 2 6 2 3 13
Batting

TB: Jonathan Santiago, Andrew Poirier, Grant Thompson 3, Patrick Keohane
RBI: Jonathan Santiago, Grant Thompson
SF: Jonathan Santiago
HBP: Andrew Poirier

Totals

Team QAB: 17 (45.95%)
Jonathan Santiago 2, Garrison Vick, Andrew Poirier 3, Matt Van Muelken, Grant Thompson, Patrick Keohane 2, Christian Concepcion, Elijah Ervin 3, Derrek Marshall Jr. 2, Tyler Young

Team LOB: 8

Fielding

E: Derrek Marshall Jr., Tyler Young

.
Greenbrier Knights
Pitching IP #P S% H R ER K BB HR
Teddy Herbert 6.0 131 .603 6 2 2 8 2 0
Stephen Baughan 2.0 18 .889 0 0 0 3 0 0
Colin Ottofaro 1.0 17 .529 0 0 0 2 1 0
Totals 9.0 166 .627 6 2 2 13 3 0
Pitching

W: Teddy Herbert
HBP: Teddy Herbert
Pitches-Strikes: Teddy Herbert 131-79, Colin Ottofaro 17-9, Stephen Baughan 18-16
Groundouts-Flyouts: Teddy Herbert 1-9, Colin Ottofaro 1-0, Stephen Baughan 0-3
First pitch strikes-Batters faced: Teddy Herbert 13-27, Colin Ottofaro 2-4, Stephen Baughan 5-6

Sandbride Seagulls
Pitching IP #P S% H R ER K BB HR
Andrew Griffin 5.0 83 .675 6 8 6 4 2 0
Tyler Key 1.0 21 .429 1 1 1 0 2 0
Nicholas Palermo 3.0 55 .564 3 1 1 1 2 0
Totals 9.0 159 .604 10 10 8 5 6 0
Pitching

L: Andrew Griffin
HBP: Nicholas Palermo
WP: Nicholas Palermo
Pitches-Strikes: Andrew Griffin 83-56, Nicholas Palermo 55-31, Tyler Key 21-9
Groundouts-Flyouts: Andrew Griffin 5-6, Nicholas Palermo 3-4, Tyler Key 1-1
First pitch strikes-Batters faced: Andrew Griffin 18-25, Nicholas Palermo 8-15, Tyler Key 4-6

Key
  • AB: At bats
  • R: Runs scored
  • H: Hits
  • RBI: Runs batted in
  • BB: Base on balls (walks)
  • K: Strikeouts
  • 2B: Doubles
  • 3B: Triples
  • HR: Home runs
  • Grand slam: Grand slam home runs
  • TB: Total bases
  • RBI: Runs batted in
  • SAC: Sacrifice hits & bunts
  • SF: Sacrifice flies
  • ROE: Reached on error
  • FC: Hit into fielder’s choice
  • HBP: Hit by pitch
  • CI: Batter advances on catcher’s interference
  • GIDP: Hit into double play
  • GITP: Hit into triple play
  • SB: Stolen bases
  • CS: Caught stealing
  • PIK: Picked off
  • QAB: Quality at bats (any one of: 3 pitches after 2 strikes, 6+ pitch ABs, XBH, HHB, BB, SAC Bunt, SAC Fly)
  • QAB%: Quality at bats per plate appearance
  • LOB: Runners left on base at the end of an inning
  • E: Errors
  • DP: Double Plays
  • TP: Triple Plays
  • IP: Innings Pitched
  • #P: Total pitches
  • S%: Strike percentage
  • H: Hits allowed
  • R: Runs allowed
  • ER: Earned runs allowed
  • K: Strikeouts
  • BB: Base on balls (walks)
  • HR: Home runs allowed
  • W: Wins
  • L: Losses
  • SV: Saves
  • BS: Blown saves
  • HBP: Hit batters
  • WP: Wild pitches
  • BK: Balks

Norfolk Bluefish 6, Chesapeake Suns 5

Bluefish Wins Back-And-Forth Affair Against Suns

June 30, 2017 – Virginia Beach, VA

Bluefish defeated Suns 6-5 in a back-and-forth affair on Friday. The game was tied at five with Bluefish batting in the bottom of the seventh when.

Bluefish captured the lead in the first inning. Cody McSwain’s sac fly scored one run for Bluefish.

Stephen Larson earned the win for Bluefish. He went seven innings, surrendering five runs, nine hits, and striking out three. Alec Berry threw one inning, as two relievers helped Bluefishfinish off the victory. Berry recorded the last three outs to earn the save for Bluefish. Lane Madsen took the loss for Suns. He pitched one-third of an inning, allowing four runs, three hits, and striking out one.

Eric O’Brien started the game for Suns. He tossed six innings, surrendering two runs, four hits, striking out three, and walking zero.

Noah Herried, McSwain, and MacMilan Shoenman each drove in one run to lead Bluefish.

Suns collected 11 hits. Lawrence Cicileo, Tynan Hoefferle, Austin Thomas, and Harris each collected multiple hits for Suns.

“Powered by Narrative Science and GameChanger Media. Copyright 2017. All rights reserved.” 

1 2 3 4 5 6 7 8 9 r H
SUNS 0 1 2 0 1 1 0 0 0 5 11 1
BLFS 1 0 1 0 0 0 4 0 X 6 8 1

BOX SCORE

Chesapeake Suns
Lineup AB R H RBI BB K
Harris 5 1 2 0 0 1
Jamarius Epperson 4 0 0 1 0 0
Brad Pearson 3 1 1 0 1 1
Austin Thomas 4 0 2 1 0 0
Andrew Rodriguez 3 1 1 0 1 1
Jarad Clevenger 0 0 0 0 0 0
Michael Perlo 1 0 0 0 0 1
Meigs Lamb 1 0 0 0 0 1
Lawrence Cicileo 4 1 2 1 0 1
Tynan Hoefferle 4 0 2 1 0 0
Justin Bunting 3 1 1 0 0 0
Corey King
Lane Madsen
Eric O’Brien
Michael Parmely
Totals 32 5 11 4 2 6
Batting

HR: Lawrence Cicileo
TB: Justin Bunting, Lawrence Cicileo 5, Harris 2, Tynan Hoefferle 2, Brad Pearson, Andrew Rodriguez, Austin Thomas 2
RBI: Lawrence Cicileo, Jamarius Epperson, Tynan Hoefferle, Austin Thomas
SAC: Justin Bunting
HBP: Meigs Lamb, Michael Perlo
GIDP: Tynan Hoefferle
SB: Jarad Clevenger, Brad Pearson
CS: Harris, Tynan Hoefferle, Austin Thomas

Totals

Team QAB: 19 (51.35%)
Justin Bunting 2, Lawrence Cicileo 2, Jamarius Epperson, Harris 3, Tynan Hoefferle 3, Brad Pearson 3, Andrew Rodriguez 3, Austin Thomas 2

Team LOB: 5

Fielding

E: Andrew Rodriguez
DP: Justin Bunting, Tynan Hoefferle, Corey King

Norfolk Bluefish
Lineup AB R H RBI BB K
MacMilan Shoenman 4 2 3 1 0 0
Noah Herried 3 0 0 1 1 0
Cody McSwain 2 0 1 1 1 0
Spencer Muirhead 4 0 0 0 0 0
Daniel Haskell 4 0 1 0 0 2
Delmarcus Talley 4 1 1 0 0 0
Jake Odom 3 1 1 0 1 0
Cody Steffey 3 1 0 0 1 2
Brelin Carroll 3 1 1 0 0 1
Stephen Larson
Alec Berry
Ashton Knutson
Totals 30 6 8 3 4 5
Batting

2B: Brelin Carroll, MacMilan Shoenman, Delmarcus Talley
TB: Brelin Carroll 2, Daniel Haskell, Cody McSwain, Jake Odom, MacMilan Shoenman 4, Delmarcus Talley 2
RBI: Noah Herried, Cody McSwain, MacMilan Shoenman
SF: Cody McSwain
ROE: Noah Herried
GIDP: Delmarcus Talley
SB: Noah Herried

Totals

Team QAB: 17 (48.57%)
Brelin Carroll, Daniel Haskell 3, Noah Herried, Cody McSwain 3, Spencer Muirhead, Jake Odom 3, MacMilan Shoenman, Cody Steffey 3, Delmarcus Talley

Team LOB: 5

Fielding

E: Jake Odom
DP: Daniel Haskell 2, Noah Herried, Jake Odom

.
Chesapeake Suns
Pitching IP #P S% H R ER K BB HR
Eric O’Brien 6.0 80 .650 4 2 1 3 0 0
Lane Madsen 0.1 28 .464 3 4 3 1 3 0
Michael Parmely 1.2 24 .708 1 0 0 1 1 0
Totals 8.0 132 .621 8 6 4 5 4 0
Pitching

L: Lane Madsen
WP: Lane Madsen
Pitches-Strikes: Lane Madsen 28-13, Eric O’Brien 80-52, Michael Parmely 24-17
Groundouts-Flyouts: Lane Madsen 0-0, Eric O’Brien 7-8, Michael Parmely 1-1
First pitch strikes-Batters faced: Lane Madsen 5-7, Eric O’Brien 15-23, Michael Parmely 3-6

Norfolk Bluefish
Pitching IP #P S% H R ER K BB HR
Stephen Larson 7.0 100 .570 9 5 3 3 2 1
Ashton Knutson 1.0 11 1.000 1 0 0 2 0 0
Alec Berry 1.0 10 .600 1 0 0 1 0 0
Totals 9.0 121 .612 11 5 3 6 2 1
Pitching

W: Stephen Larson
SV: Alec Berry
HBP: Stephen Larson 2
WP: Stephen Larson 2, Alec Berry
Pitches-Strikes: Stephen Larson 100-57, Alec Berry 10-6, Ashton Knutson 11-11
Groundouts-Flyouts: Stephen Larson 5-9, Alec Berry 1-0, Ashton Knutson 0-1
First pitch strikes-Batters faced: Stephen Larson 16-30, Alec Berry 2-3, Ashton Knutson 4-4

Key
  • AB: At bats
  • R: Runs scored
  • H: Hits
  • RBI: Runs batted in
  • BB: Base on balls (walks)
  • K: Strikeouts
  • 2B: Doubles
  • 3B: Triples
  • HR: Home runs
  • Grand slam: Grand slam home runs
  • TB: Total bases
  • RBI: Runs batted in
  • SAC: Sacrifice hits & bunts
  • SF: Sacrifice flies
  • ROE: Reached on error
  • FC: Hit into fielder’s choice
  • HBP: Hit by pitch
  • CI: Batter advances on catcher’s interference
  • GIDP: Hit into double play
  • GITP: Hit into triple play
  • SB: Stolen bases
  • CS: Caught stealing
  • PIK: Picked off
  • QAB: Quality at bats (any one of: 3 pitches after 2 strikes, 6+ pitch ABs, XBH, HHB, BB, SAC Bunt, SAC Fly)
  • QAB%: Quality at bats per plate appearance
  • LOB: Runners left on base at the end of an inning
  • E: Errors
  • DP: Double Plays
  • TP: Triple Plays
  • IP: Innings Pitched
  • #P: Total pitches
  • S%: Strike percentage
  • H: Hits allowed
  • R: Runs allowed
  • ER: Earned runs allowed
  • K: Strikeouts
  • BB: Base on balls (walks)
  • HR: Home runs allowed
  • W: Wins
  • L: Losses
  • SV: Saves
  • BS: Blown saves
  • HBP: Hit batters
  • WP: Wild pitches
  • BK: Balks

Lynnhaven Pelicans 12, Virginia Beach Waves 4.

Waves Can’t Hold Up Against Pelicans

June 30, 2017 – Virginia Beach, VA

Waves couldn’t keep up with Pelicans and fell 12-4 on Friday.

Waves took an early lead in the second inning. Jackson Posnik grounded out, scoring one run.

Pelicans took the lead for good with three runs in the third inning. In the third Christian Riverainduced Jackson Peterson to ground out, but one run scored, Pat Downey singled off of Rivera, driving in one run, and Joe Klingensmith hit a sacrifice fly to drive in a run.

Pelicans scored five runs in the ninth inning. Pelicans’s big inning was driven by a single by Peterson, a single by Justin Hayes, and a home run by Harrison Sabo.

Ean Walda earned the win for Pelicans. He threw seven innings, giving up two runs, eight hits, and striking out seven. Two relievers helped Pelicans close out the victory. Chance Harveythrew one inning. Rivera took the loss for Waves. He tossed eight innings, giving up seven runs, nine hits, and striking out seven.

Waves had 11 hits in the game. Colin Mattice, Declan O’Malley, and Collin Porter each collected multiple hits for Waves. Porter, Posnik, Kevin Roberts, and Mattice each drove in one run to lead Waves.

Pelicans collected 13 hits. Hayes, Sabo, Austin Elledge, and Peterson each collected multiple hits for Pelicans.

“Powered by Narrative Science and GameChanger Media. Copyright 2017. All rights reserved.” 

1 2 3 4 5 6 7 8 9 r h
PLCN 0 0 3 1 0 3 0 0 5 12 13 2
WVS 0 1 0 0 0 1 0 2 0 4 11 4

BOX SCORE

Lynnhaven Pelicans
Lineup AB R H RBI BB K
Jackson Peterson 6 1 2 3 0 0
Justin Hayes 4 3 3 1 1 1
Harrison Sabo 4 2 3 4 0 0
Josh Crummer 5 0 1 0 1 0
Pat Downey 4 0 1 2 1 1
Joe Klingensmith 1 0 0 1 2 1
Casey Turner 2 0 0 0 0 1
Santino Paris 4 1 1 0 1 2
Drew Novetsky 4 2 0 0 1 1
Austin Elledge 4 3 2 0 1 0
Chance Harvey
Ean Walda
Nick Wood
Totals 38 12 13 11 8 7
Batting

3B: Austin Elledge
HR: Harrison Sabo
TB: Josh Crummer, Pat Downey, Austin Elledge 4, Justin Hayes 3, Santino Paris, Jackson Peterson 2, Harrison Sabo 6
RBI: Pat Downey 2, Justin Hayes, Joe Klingensmith, Jackson Peterson 3, Harrison Sabo 4
SF: Pat Downey, Joe Klingensmith, Harrison Sabo 2
ROE: Josh Crummer, Austin Elledge, Drew Novetsky, Santino Paris
FC: Austin Elledge, Drew Novetsky
HBP: Justin Hayes
GIDP: Drew Novetsky
SB: Justin Hayes

Totals

Team QAB: 21 (41.18%)
Josh Crummer, Pat Downey 4, Austin Elledge 2, Justin Hayes 3, Joe Klingensmith 3, Drew Novetsky, Santino Paris 2, Jackson Peterson, Harrison Sabo 3, Casey Turner

Team LOB: 12

Fielding

E: Austin Elledge 2
DP: Josh Crummer 2, Austin Elledge 2, Drew Novetsky 2

Virginia Beach Waves
Lineup AB R H RBI BB K
Ross Abrash 5 0 1 0 0 0
Thomas Meucci 4 0 1 0 1 1
Jonathan Lindau 5 0 1 0 0 1
Declan O’Malley 5 1 2 0 0 0
Brandon Kussmaul 3 2 1 0 2 0
Collin Porter 4 1 2 1 0 0
Jackson Posnik 2 0 0 1 0 1
Colin Mattice 2 0 2 1 0 0
Samuel Czel 4 0 0 0 0 4
James Wyatt 2 0 0 0 0 1
Kevin Roberts 2 0 1 1 0 0
Jacob Day
Christian Rivera
Totals 38 4 11 4 3 8
Batting

TB: Colin Mattice 2, Brandon Kussmaul, Jonathan Lindau, Ross Abrash, Thomas Meucci, Kevin Roberts, Declan O’Malley 2, Collin Porter 2
RBI: Colin Mattice, Kevin Roberts, Collin Porter, Jackson Posnik
ROE: Kevin Roberts, Collin Porter
FC: Brandon Kussmaul, Declan O’Malley
GIDP: Jonathan Lindau, Declan O’Malley
SB: Brandon Kussmaul

Totals

Team QAB: 14 (34.15%)
Colin Mattice, Brandon Kussmaul 3, Jonathan Lindau, Ross Abrash, Thomas Meucci 3, Kevin Roberts 2, Collin Porter, Jackson Posnik 2

Team LOB: 10

Fielding

E: Colin Mattice, Brandon Kussmaul 2, Thomas Meucci
DP: Thomas Meucci, Declan O’Malley

.
Lynnhaven Pelicans
Pitching IP #P S% H R ER K BB HR
Ean Walda 7.0 108 .648 8 2 2 7 2 0
Chance Harvey 1.0 20 .700 3 2 0 1 0 0
Nick Wood 1.0 14 .643 0 0 0 0 1 0
Totals 9.0 142 .655 11 4 2 8 3 0
Pitching

W: Ean Walda
Pitches-Strikes: Chance Harvey 20-14, Ean Walda 108-70, Nick Wood 14-9
Groundouts-Flyouts: Chance Harvey 1-0, Ean Walda 6-6, Nick Wood 0-2
First pitch strikes-Batters faced: Chance Harvey 4-7, Ean Walda 17-30, Nick Wood 2-4

Virginia Beach Waves
Pitching IP #P S% H R ER K BB HR
Christian Rivera 8.0 144 .583 9 7 4 7 7 0
Jacob Day 1.0 22 .682 4 5 1 0 1 1
Totals 9.0 166 .596 13 12 5 7 8 1
Pitching

L: Christian Rivera
HBP: Christian Rivera
Pitches-Strikes: Jacob Day 22-15, Christian Rivera 144-84
Groundouts-Flyouts: Jacob Day 0-2, Christian Rivera 5-9
First pitch strikes-Batters faced: Jacob Day 6-9, Christian Rivera 26-42

Key
  • AB: At bats
  • R: Runs scored
  • H: Hits
  • RBI: Runs batted in
  • BB: Base on balls (walks)
  • K: Strikeouts
  • 2B: Doubles
  • 3B: Triples
  • HR: Home runs
  • Grand slam: Grand slam home runs
  • TB: Total bases
  • RBI: Runs batted in
  • SAC: Sacrifice hits & bunts
  • SF: Sacrifice flies
  • ROE: Reached on error
  • FC: Hit into fielder’s choice
  • HBP: Hit by pitch
  • CI: Batter advances on catcher’s interference
  • GIDP: Hit into double play
  • GITP: Hit into triple play
  • SB: Stolen bases
  • CS: Caught stealing
  • PIK: Picked off
  • QAB: Quality at bats (any one of: 3 pitches after 2 strikes, 6+ pitch ABs, XBH, HHB, BB, SAC Bunt, SAC Fly)
  • QAB%: Quality at bats per plate appearance
  • LOB: Runners left on base at the end of an inning
  • E: Errors
  • DP: Double Plays
  • TP: Triple Plays
  • IP: Innings Pitched
  • #P: Total pitches
  • S%: Strike percentage
  • H: Hits allowed
  • R: Runs allowed
  • ER: Earned runs allowed
  • K: Strikeouts
  • BB: Base on balls (walks)
  • HR: Home runs allowed
  • W: Wins
  • L: Losses
  • SV: Saves
  • BS: Blown saves
  • HBP: Hit batters
  • WP: Wild pitches
  • BK: Balks

Lynnhaven Pelicans 6, Outer Banks Daredevils 0.

Daredevils Loses Lead Early In Defeat

June 29, 2017 – Kill Devil Hills, NC

Daredevils watched the game slip away early and couldn’t recover in a 6-0 loss to Pelicans on Thursday. Pelicans took the lead on a single in the first inning.

Pelicans took an early lead in the first inning. Tom Kelley drove in one when he singled in the first inning.

Pelicans scored three runs in the eighth inning. Pelicans’s big inning was driven by a single by Nick Graham.

One bright spot for Daredevils was a single by Andrew Kasiski in the sixth inning.

Samuel Wood earned the win for Pelicans. He went nine innings, surrendering zero runs, three hits, and striking out seven. Ryan Allen took the loss for Daredevils. He tossed seven innings, surrendering three runs, six hits, and striking out three.

Ryan Williams, Kasiski, and Derek Horton each managed one hit to lead Daredevils.

Pelicans had ten hits in the game. Justin Hayes, Chayton Lukkes, and Pat Downey each collected multiple hits for Pelicans. Pelicans was sure-handed in the field and didn’t commit a single error. Tyler Jones had the most chances in the field with seven.

“Powered by Narrative Science and GameChanger Media. Copyright 2017. All rights reserved.” 

1 2 3 4 5 6 7 8 9 R H
PLCN 1 0 1 0 0 0 1 3 0 6 10 0
DVLS 0 0 0 0 0 0 0 0 0 0 3 6

BOX SCORE

Lynnhaven Pelicans
Lineup AB R H RBI BB K
Jackson Peterson 3 3 1 1 0 0
Justin Hayes 4 0 2 0 1 1
Nick Graham 2 0 1 2 2 0
Tom Kelley 4 0 1 1 1 2
Justin Burrell 5 0 1 0 0 0
Pat Downey 5 0 2 0 0 1
Michael Diodato 4 1 0 0 1 1
Chayton Lukkes 4 1 2 0 0 1
Tyler Jones 4 1 0 0 0 0
Samuel Wood
Totals 35 6 10 4 5 6
Batting

2B: Justin Burrell
TB: Justin Burrell 2, Pat Downey 2, Nick Graham, Justin Hayes 2, Tom Kelley, Chayton Lukkes 2, Jackson Peterson
RBI: Nick Graham 2, Tom Kelley, Jackson Peterson
SF: Jackson Peterson
ROE: Michael Diodato, Jackson Peterson
FC: Tyler Jones
HBP: Nick Graham, Chayton Lukkes, Jackson Peterson
SB: Justin Hayes 2, Jackson Peterson
CS: Justin Burrell
PIK: Chayton Lukkes

Totals

Team QAB: 12 (27.27%)
Justin Burrell 2, Michael Diodato, Pat Downey, Nick Graham 3, Justin Hayes, Tyler Jones, Tom Kelley 2, Jackson Peterson

Team LOB: 11

Outer Banks Daredevils
Lineup AB R H RBI BB K
Damian Hairston 2 0 0 0 1 0
Andrew Kasiski 4 0 1 0 0 0
Eli Straw 4 0 0 0 0 2
Payton Holdsworth 3 0 0 0 1 0
Ryan Williams 4 0 1 0 0 1
Bubba Ruiz 3 0 0 0 1 1
Brent West 3 0 0 0 0 0
Derek Horton 2 0 1 0 0 0
Benji Rippons 2 0 0 0 0 2
Josh Healy 1 0 0 0 0 1
Chris Day
Ryan Allen
Ryan Gallacio
Totals 28 0 3 0 3 7
Batting

TB: Ryan Williams, Andrew Kasiski, Derek Horton
SAC: Derek Horton
FC: Eli Straw
HBP: Damian Hairston, Brent West
CS: Payton Holdsworth

Totals

Team QAB: 16 (47.06%)
Ryan Williams, Bubba Ruiz 2, Andrew Kasiski 2, Eli Straw 3, Damian Hairston, Derek Horton 2, Payton Holdsworth 2, Josh Healy, Brent West 2

Team LOB: 7

Fielding

E: Bubba Ruiz 2, Benji Rippons 4
DP: Brent West

.
Lynnhaven Pelicans
Pitching IP #P S% H R ER K BB HR
Samuel Wood 9.0 99 .596 3 0 0 7 3 0
Totals 9.0 99 .596 3 0 0 7 3 0
Pitching

W: Samuel Wood
HBP: Samuel Wood 2
Pitches-Strikes: Samuel Wood 99-59
Groundouts-Flyouts: Samuel Wood 11-7
First pitch strikes-Batters faced: Samuel Wood 20-34

Outer Banks Daredevils
Pitching IP #P S% H R ER K BB HR
Ryan Allen 7.0 95 .632 6 3 0 3 3 0
Chris Day 0.2 6 1.000 2 3 0 0 0 0
Ryan Gallacio 1.1 31 .484 2 0 0 3 2 0
Totals 9.0 132 .614 10 6 0 6 5 0
Pitching

L: Ryan Allen
HBP: Ryan Allen 3
WP: Ryan Gallacio
Pitches-Strikes: Chris Day 6-6, Ryan Allen 95-60, Ryan Gallacio 31-15
Groundouts-Flyouts: Chris Day 0-1, Ryan Allen 3-13, Ryan Gallacio 0-0
First pitch strikes-Batters faced: Chris Day 5-5, Ryan Allen 23-32, Ryan Gallacio 5-7

Key
  • AB: At bats
  • R: Runs scored
  • H: Hits
  • RBI: Runs batted in
  • BB: Base on balls (walks)
  • K: Strikeouts
  • 2B: Doubles
  • 3B: Triples
  • HR: Home runs
  • Grand slam: Grand slam home runs
  • TB: Total bases
  • RBI: Runs batted in
  • SAC: Sacrifice hits & bunts
  • SF: Sacrifice flies
  • ROE: Reached on error
  • FC: Hit into fielder’s choice
  • HBP: Hit by pitch
  • CI: Batter advances on catcher’s interference
  • GIDP: Hit into double play
  • GITP: Hit into triple play
  • SB: Stolen bases
  • CS: Caught stealing
  • PIK: Picked off
  • QAB: Quality at bats (any one of: 3 pitches after 2 strikes, 6+ pitch ABs, XBH, HHB, BB, SAC Bunt, SAC Fly)
  • QAB%: Quality at bats per plate appearance
  • LOB: Runners left on base at the end of an inning
  • E: Errors
  • DP: Double Plays
  • TP: Triple Plays
  • IP: Innings Pitched
  • #P: Total pitches
  • S%: Strike percentage
  • H: Hits allowed
  • R: Runs allowed
  • ER: Earned runs allowed
  • K: Strikeouts
  • BB: Base on balls (walks)
  • HR: Home runs allowed
  • W: Wins
  • L: Losses
  • SV: Saves
  • BS: Blown saves
  • HBP: Hit batters
  • WP: Wild pitches
  • BK: Balks

Norfolk Bluefish 12, Greenbrier Knights 11

Edgar’s Walkoff Gives Bluefish Victory Over Knights

June 29, 2017 – Virginia Beach, VA

Bluefish defeated Knights 12-11 on Thursday thanks to a walk-off walk. The game was tied at 11 with Bluefish batting in the bottom of the ninth when Thomas Chisam walked Kevin Edgar to drive in a run.

Bluefish built a five-run lead in the fourth inning and then held off Knights’s charge. Knightsscored eight runs in the failed comeback on a single by Nick Lees in the sixth, a error in the sixth, a double by Thomas Chisam in the sixth, a double by Stephen Baughan in the sixth, a groundout by Robert Scott in the seventh, and a walk in the seventh.

Knights took an early lead in the second inning. With one out in the second inning Trent Jonesdrove in one run when he doubled.

After Knights scored one run in the top of the fourth, Bluefish answered with one of their own.Bluefish then answered when there was an error, scoring one run.

Knights scored six runs in the sixth inning. Knights’s big inning was driven by a single by Lees, a error, a double by Chisam, and a double by Baughan.

Cody Steffey earned the win for Bluefish. He tossed one inning, allowing zero runs, zero hits, and walking one. Chisam took the loss for Knights. He threw two-thirds of an inning, allowing one run, and one hit.

Josh Reilly started the game for Knights. He pitched two innings, giving up five runs, and three hits. Trevor Lloyd started the game for Bluefish. He went four innings, surrendering three runs, six hits, and striking out five.

Bluefish had 12 hits in the game. MacMilan Shoenman, Kevin Edgar, Noah Herried, and Ashton Knutson each collected multiple hits for Bluefish. Herried, Chadler Young, Edgar, and Shoenman each drove in two runs to lead Bluefish.

Knights collected 12 hits. Chisam, Jones, and Baughan each collected multiple hits for Knights.

“Powered by Narrative Science and GameChanger Media. Copyright 2017. All rights reserved.” 

1 2 3 4 5 6 7 8 9 r h
KNGT 0 2 0 1 0 6 2 0 0 11 12 3
BLFS 0 5 2 1 0 0 0 2 2 12 12 3

BOX SCORES

Greenbrier Knights
Lineup AB R H RBI BB K
Trent Jones 5 1 2 1 1 1
Jay Brandt 2 1 1 0 1 0
Robert Scott 2 0 0 1 0 0
Christopher Harper 2 0 0 0 0 1
Chris Guilles 3 1 1 1 0 1
Henry Moore 4 1 1 0 2 0
Thomas Chisam 5 1 2 2 1 1
Stephen Baughan 5 1 2 2 1 0
Zachary Herring 3 1 1 0 1 1
Matt Polak 2 0 0 0 0 0
Bennie Spady 2 0 0 0 0 2
Bryce Jones 3 1 1 0 0 0
Nick Lees 2 3 1 2 2 0
Alex Abbey
Josh Reilly
Isaiah Junkins
Totals 40 11 12 9 9 7
Batting

2B: Trent Jones, Bryce Jones, Thomas Chisam 2, Stephen Baughan 2, Chris Guilles
TB: Henry Moore, Jay Brandt, Nick Lees, Zachary Herring, Trent Jones 3, Bryce Jones 2, Thomas Chisam 4, Stephen Baughan 4, Chris Guilles 2
RBI: Robert Scott, Nick Lees 2, Trent Jones, Thomas Chisam 2, Stephen Baughan 2, Chris Guilles
SF: Chris Guilles
ROE: Jay Brandt, Trent Jones, Thomas Chisam
FC: Nick Lees
HBP: Nick Lees
SB: Henry Moore, Nick Lees

Totals

Team QAB: 25 (49.02%)
Henry Moore 3, Jay Brandt 2, Robert Scott, Nick Lees 2, Zachary Herring, Trent Jones 3, Bryce Jones, Thomas Chisam 4, Matt Polak, Stephen Baughan 5, Chris Guilles 2

Team LOB: 13

Fielding

E: Nick Lees, Zachary Herring, Josh Reilly
DP: Jay Brandt 2, Nick Lees, Zachary Herring 2, Chris Guilles

Norfolk Bluefish
Lineup AB R H RBI BB K
MacMilan Shoenman 6 2 3 2 0 1
Noah Herried 4 0 2 2 2 1
Kevin Edgar 5 1 2 2 1 1
Cody McSwain 2 2 1 1 3 0
Daniel Haskell 3 2 0 0 1 0
Diggy Cimaroli 3 1 0 1 2 1
Chadler Young 3 1 1 2 0 1
Ashton Knutson 4 1 2 0 0 1
Spencer Muirhead 0 1 0 0 1 0
Michael Rojas 4 1 1 0 0 0
Trevor Lloyd
Jake Odom
Cody Steffey
Delmarcus Talley
Totals 34 12 12 10 10 6
Batting

2B: Noah Herried
TB: Kevin Edgar 2, Noah Herried 3, Ashton Knutson 2, Cody McSwain, Michael Rojas, MacMilan Shoenman 3, Chadler Young
RBI: Kevin Edgar 2, Noah Herried 2, Cody McSwain, MacMilan Shoenman 2, Chadler Young 2, Diggy Cimaroli
ROE: Daniel Haskell
FC: Daniel Haskell, Ashton Knutson
HBP: Daniel Haskell, Michael Rojas, Chadler Young 2
GIDP: Kevin Edgar, Michael Rojas
CS: Daniel Haskell
PIK: Chadler Young

Totals

Team QAB: 26 (54.17%)
Kevin Edgar 4, Daniel Haskell 2, Noah Herried 5, Ashton Knutson, Cody McSwain 4, Spencer Muirhead, Michael Rojas, MacMilan Shoenman 3, Chadler Young 2, Diggy Cimaroli 3

Team LOB: 7

Fielding

E: Noah Herried, Michael Rojas 2
DP: Daniel Haskell, Diggy Cimaroli

.
Greenbrier Knights
Pitching IP #P S% H R ER K BB HR
Josh Reilly 2.0 40 .425 3 5 0 0 2 0
Isaiah Junkins 3.0 56 .482 3 3 2 1 3 0
Matt Polak 3.0 62 .677 5 3 3 5 2 0
Thomas Chisam 0.2 29 .414 1 1 1 0 3 0
Totals 8.2 187 .524 12 12 6 6 10 0
Pitching

L: Thomas Chisam
HBP: Josh Reilly, Isaiah Junkins 3
Pitches-Strikes: Thomas Chisam 29-12, Matt Polak 62-42, Josh Reilly 40-17, Isaiah Junkins 56-27
Groundouts-Flyouts: Thomas Chisam 1-1, Matt Polak 1-2, Josh Reilly 3-2, Isaiah Junkins 2-1
First pitch strikes-Batters faced: Thomas Chisam 2-6, Matt Polak 7-15, Josh Reilly 3-12, Isaiah Junkins 7-15

Norfolk Bluefish
Pitching IP #P S% H R ER K BB HR
Trevor Lloyd 4.0 93 .570 6 3 3 5 4 0
Jake Odom 1.1 36 .611 4 6 5 1 1 0
Delmarcus Talley 2.2 57 .491 2 2 0 1 3 0
Cody Steffey 1.0 12 .500 0 0 0 0 1 0
Totals 9.0 198 .551 12 11 8 7 9 0
Pitching

W: Cody Steffey
HBP: Delmarcus Talley
Pitches-Strikes: Trevor Lloyd 93-53, Jake Odom 36-22, Cody Steffey 12-6, Delmarcus Talley 57-28
Groundouts-Flyouts: Trevor Lloyd 1-4, Jake Odom 3-0, Cody Steffey 1-2, Delmarcus Talley 2-5
First pitch strikes-Batters faced: Trevor Lloyd 11-21, Jake Odom 6-10, Cody Steffey 3-5, Delmarcus Talley 7-15

Key
  • AB: At bats
  • R: Runs scored
  • H: Hits
  • RBI: Runs batted in
  • BB: Base on balls (walks)
  • K: Strikeouts
  • 2B: Doubles
  • 3B: Triples
  • HR: Home runs
  • Grand slam: Grand slam home runs
  • TB: Total bases
  • RBI: Runs batted in
  • SAC: Sacrifice hits & bunts
  • SF: Sacrifice flies
  • ROE: Reached on error
  • FC: Hit into fielder’s choice
  • HBP: Hit by pitch
  • CI: Batter advances on catcher’s interference
  • GIDP: Hit into double play
  • GITP: Hit into triple play
  • SB: Stolen bases
  • CS: Caught stealing
  • PIK: Picked off
  • QAB: Quality at bats (any one of: 3 pitches after 2 strikes, 6+ pitch ABs, XBH, HHB, BB, SAC Bunt, SAC Fly)
  • QAB%: Quality at bats per plate appearance
  • LOB: Runners left on base at the end of an inning
  • E: Errors
  • DP: Double Plays
  • TP: Triple Plays
  • IP: Innings Pitched
  • #P: Total pitches
  • S%: Strike percentage
  • H: Hits allowed
  • R: Runs allowed
  • ER: Earned runs allowed
  • K: Strikeouts
  • BB: Base on balls (walks)
  • HR: Home runs allowed
  • W: Wins
  • L: Losses
  • SV: Saves
  • BS: Blown saves
  • HBP: Hit batters
  • WP: Wild pitches
  • BK: Balks