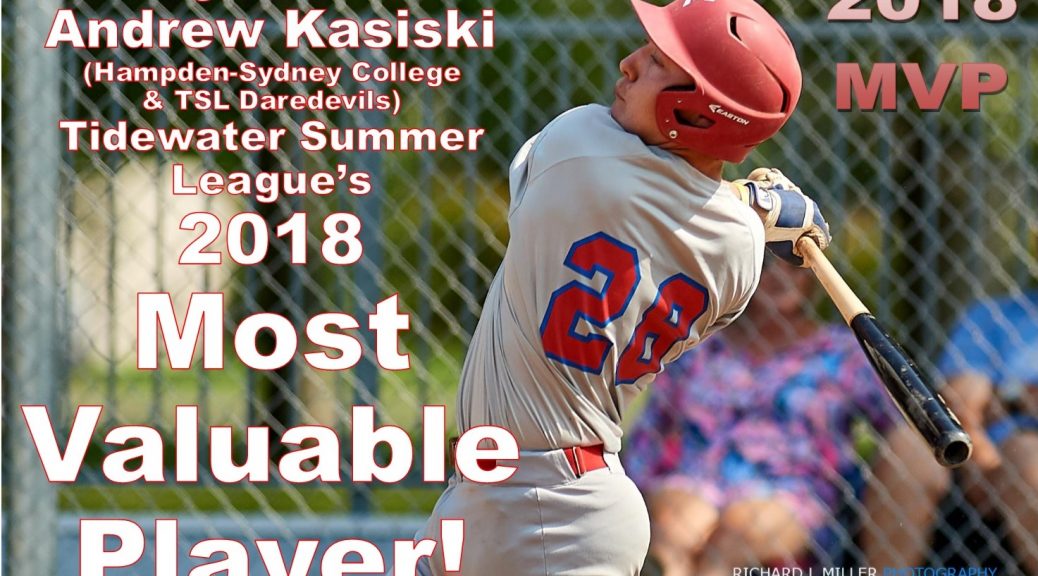
Outer Banks Daredevils catcher, Andrew Kasiski (Hampden-Sydney College) has been named the 2018 Tidewater Summer League MVP.
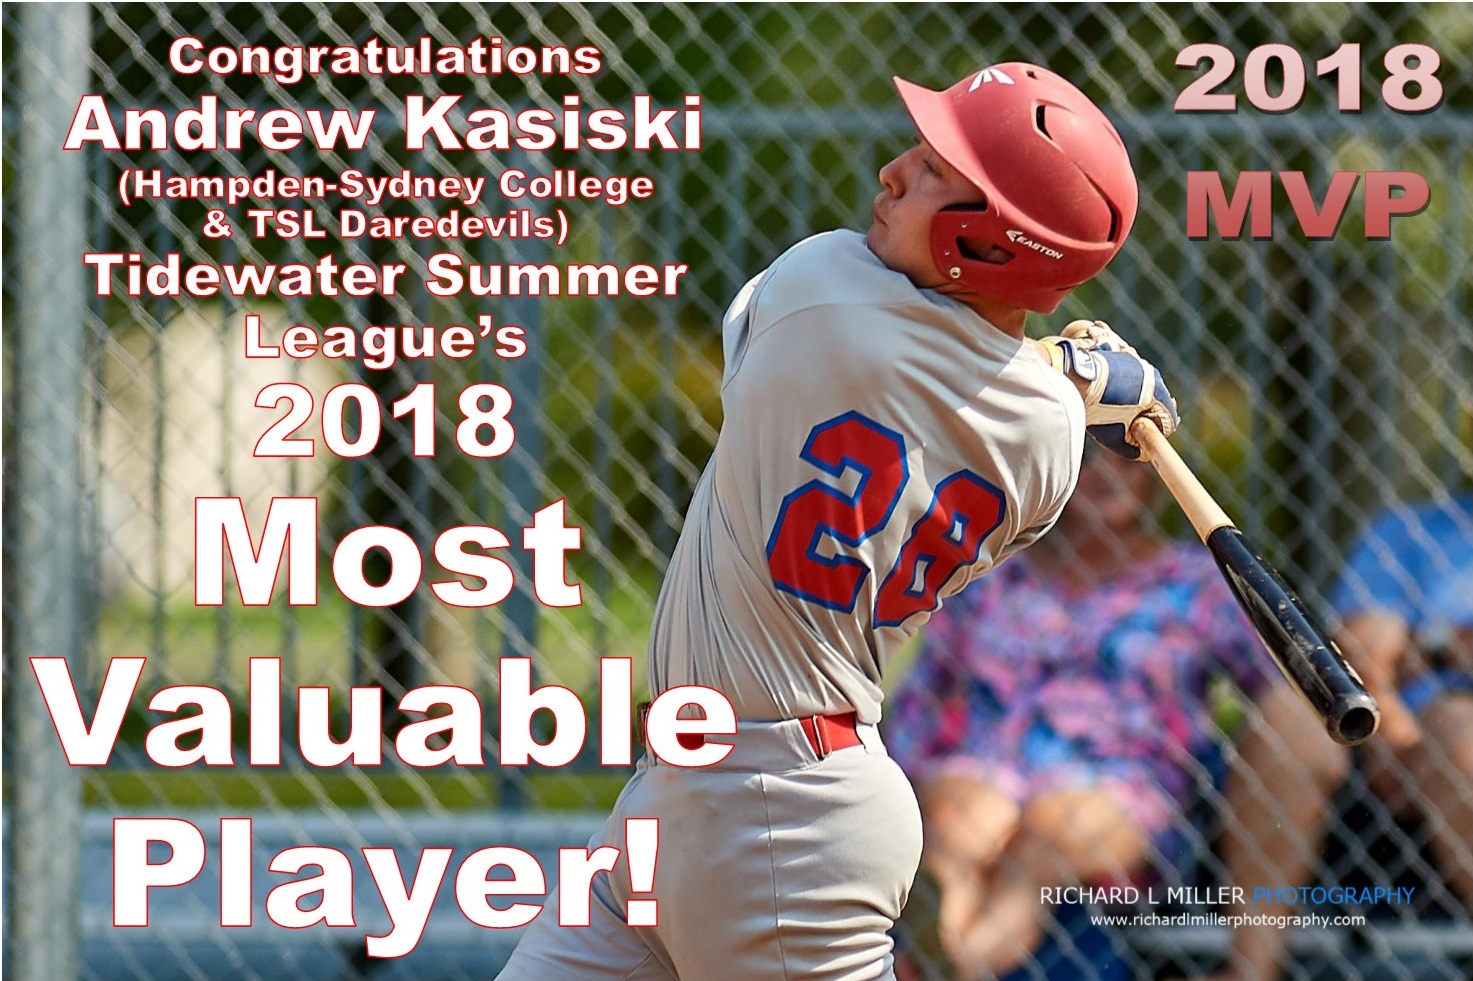
Photo Credit: Richard L. Miller Photographer
Andrew Kasiski lead the TCSBL/VBCBL in all offensive categories of consequence during the 2018 summer season, and was the unanimous choice for league MVP.
QUALITY AT BATS (QAB)
| 1. | A. Kasiski Outer Banks Daredevils |
62 |
| 2. | B. Fallon Virginia Beach Waves |
51 |
| 3. | M. Gabriele Outer Banks Daredevils |
49 |
| 4. | R. Sisto Greenbrier Knights |
48 |
| 5. | C. Gambert Norfolk Voyagers |
44 |
BATTING AVERAGE (SEASON) (AVG)
| 1. | A. Kasiski Outer Banks Daredevils |
.562 |
| 2. | M. Gabriele Outer Banks Daredevils |
.412 |
| 3. | D. Claxton Virginia Beach Shredders |
.387 |
| 4. | C. Gambert Norfolk Voyagers |
.375 |
| 5. | E. Delgado Suffolk Fightin’ Crabs |
.371 |
SLUGGING PERCENTAGE (SLG)
| 1. | A. Kasiski Outer Banks Daredevils |
.795 |
| 2. | S. Polansky Outer Banks Daredevils |
.591 |
| 3. | C. Gambert Norfolk Voyagers |
.554 |
| 4. | K. Bayles Outer Banks Daredevils |
.529 |
| 5. | M. Gabriele Outer Banks Daredevils |
.529 |
RUNS BATTED IN (RBI)
| 1. | A. Kasiski Outer Banks Daredevils |
22 |
| 2. | B. Closson Outer Banks Daredevils |
22 |
| 3. | S. Polansky Outer Banks Daredevils |
18 |
| 4. | L. McCabe Norfolk Voyagers |
18 |
| 5. | M. Gabriele Outer Banks Daredevils |
17 |
ON-BASE + SLUGGING % (OPS)
| 1. | A. Kasiski Outer Banks Daredevils |
1.464 |
| 2. | C. Gambert Norfolk Voyagers |
1.047 |
| 3. | S. Polansky Outer Banks Daredevils |
1.023 |
| 4. | M. Gabriele Outer Banks Daredevils |
1.009 |
| 5. | K. Bayles Outer Banks Daredevils |
.988 |
Andrew Kasiski 2018 season stats are below:
Standard
| # | Roster | GP | PA | AB | H | 1B | 2B | 3B | HR | RBI | R | HBP | ROE | FC | CI | BB | SO | AVG | OBP | SLG | OPS |
|---|---|---|---|---|---|---|---|---|---|---|---|---|---|---|---|---|---|---|---|---|---|
| 28 | Andrew Kasiski | 25 | 103 | 73 | 41 | 31 | 5 | 3 | 2 | 22 | 29 | 11 | 2 | 2 | 0 | 17 | 6 | .562 | .670 | .795 | 1.464 |
- GP: Games played
- PA: Plate appearances
- AB: At bats
- H: Hits
- 1B: Singles
- 2B: Doubles
- 3B: Triples
- HR: Home runs
- RBI: Runs batted in
- R: Runs scored
- HBP: Hit by pitch
- ROE: Reached on error
- FC: Hit into fielder’s choice
- CI: Batter advances on catcher’s interference
- BB: Base on balls (walks)
- SO: Strikeouts
- AVG: Batting average (season)
- OBP: On-base percentage (season)
- SLG: Slugging percentage
- OPS: On-base percentage plus slugging percentage (season)
Patience, Speed & Power
| # | Roster | GP | PA | AB | PA/BB | BB/K | C% | K-L | SB | CS | SB% | PIK | GIDP | GITP | XBH | TB | AB/HR | BA/RISP | SLG |
|---|---|---|---|---|---|---|---|---|---|---|---|---|---|---|---|---|---|---|---|
| 28 | Andrew Kasiski | 25 | 103 | 73 | 6.059 | 2.833 | .918 | 2 | 10 | 1 | .909 | 0 | 1 | 0 | 10 | 58 | 36.500 | .636 | .795 |
- GP: Games played
- PA: Plate appearances
- AB: At bats
- PA/BB: Plate appearances per walk
- BB/K: Walks per strikeout
- C%: Contact rate
- K-L: Strikeouts Looking
- SB: Stolen bases
- CS: Caught stealing
- SB%: Stolen base percentage
- PIK: Picked off
- GIDP: Hit into double play
- GITP: Hit into triple play
- XBH: Extra-base hits
- TB: Total bases
- AB/HR: At bats per home run
- BA/RISP: Batting average with runners in scoring position
- SLG: Slugging percentage
QABs & Team Impact
| # | Roster | GP | PA | AB | PS | PS/PA | 2S+3 | 2S+3% | 6+ | 6+% | FLB% | GB% | SAC | SF | LOB | 2OUTRBI | HHB | QAB | QAB% | BABIP |
|---|---|---|---|---|---|---|---|---|---|---|---|---|---|---|---|---|---|---|---|---|
| 28 | Andrew Kasiski | 25 | 103 | 73 | 372 | 3.612 | 12 | .117 | 17 | .165 | 31.88% | 37.68% | 0 | 2 | 21 | 5 | 33 | 62 | 60.19% | .582 |
- GP: Games played
- PA: Plate appearances
- AB: At bats
- PS: Pitches seen
- PS/PA: Pitches seen per plate appearance
- 2S+3: Plate appearances in which batter sees 3+ pitches after 2 strikes
- 2S+3%: % of plate appearances in which batter sees 3+ pitches after 2 strikes
- 6+: Plate appearances with 6+ pitches
- 6+%: % of plate appearances of 6+ pitches
- FLB%: Fly ball percentage
- GB%: Ground ball percentage
- SAC: Sacrifice hits & bunts
- SF: Sacrifice flies
- LOB: Runners left on base when batter is out
- 2OUTRBI: 2-out RBI
- HHB: Hard hit balls: Total line drives and hard ground balls
- QAB: Quality at bats (any one of: 3 pitches after 2 strikes, 6+ pitch ABs, XBH, HHB, BB, SAC Bunt, SAC Fly)
- QAB%: Quality at bats per plate appearance
- BABIP: Batting average on balls in play