| 1 | 2 | 3 | 4 | 5 | 6 | 7 | 8 | 9 | R | H | E | |
|---|---|---|---|---|---|---|---|---|---|---|---|---|
| DRILLERS BLUE | 0 | 1 | 0 | 1 | 0 | 2 | 3 | X | X | 7 | 9 | 2 |
| KNIGHTS | 0 | 0 | 1 | 0 | 0 | 0 | 0 | X | X | 1 | 1 | 4 |
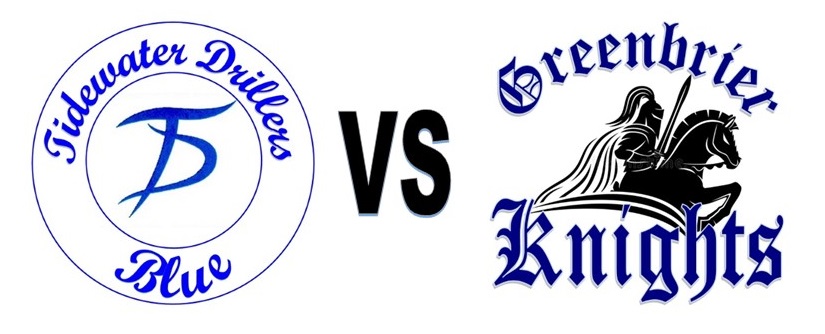
Greenbrier Knights TSL21 Takes A Tough Blow From Tidewater Drillers Blue
Sunday, July 25, 2021 – Virginia Beach, VA
Greenbrier Knights TSL21 struggled to get their offense going on Sunday, getting easily dispatched by Tidewater Drillers Blue, 7-1.
Tidewater Drillers Blue got on the board in the second inning when Garret Lyons drew a walk, scoring one run.
Greenbrier Knights TSL21 evened things up at one in the bottom of the third inning. An error scored one run for Greenbrier Knights TSL21.
Tidewater Drillers Blue pulled away for good with one run in the fourth inning. In the fourth Kyle Edwards hit a solo homer.
Tidewater Drillers Blue scored three runs in the seventh inning. The offensive firepower by Tidewater Drillers Blue was led by Lyons and Josh Prinzel, all driving in runs in the frame.
Prinzel earned the victory on the mound for Tidewater Drillers Blue. The righty lasted three innings, allowing one hit and zero runs while striking out four. Nicholas Jazkowski and Edwards entered the game out of the bullpen and helped to close out the game in relief.
Jason Covaney took the loss for Greenbrier Knights TSL21. Covaney lasted five and two-thirds innings, allowing seven hits and four runs while striking out nine.
Ian Barrett started the game for Tidewater Drillers Blue. The righthander surrendered zero runs on zero hits over one and two-thirds innings, striking out three
Matt Phoebus went 1-for-1 at the plate to lead Greenbrier Knights TSL21 in hits.
“Powered by Narrative Science and GameChanger Media. Copyright 2021. All rights reserved.”
BOX SCORE
Drillers Bluemore stats
| Lineup | AB | R | H | RBI | BB | SO |
|---|---|---|---|---|---|---|
| Ronaldo DelDuca | 3 | 1 | 1 | 0 | 0 | 1 |
| Conner Butler | 3 | 1 | 1 | 1 | 0 | 0 |
| Kyle Edwards | 2 | 1 | 1 | 1 | 1 | 1 |
| Ryan Peterson | 3 | 1 | 1 | 0 | 0 | 1 |
| Jonny Wall | 3 | 0 | 1 | 0 | 0 | 0 |
| Patrick Lundblum | 3 | 0 | 1 | 0 | 0 | 1 |
| Trent Jones | 3 | 1 | 1 | 0 | 0 | 1 |
| Wyatt Yates | 2 | 1 | 0 | 0 | 1 | 1 |
| Garret Lyons | 1 | 1 | 1 | 2 | 2 | 0 |
| Josh Prinzel | 3 | 0 | 1 | 2 | 0 | 1 |
| Bryce Jones | 3 | 0 | 0 | 0 | 0 | 1 |
| Nicholas Jazkowski | 2 | 0 | 0 | 0 | 0 | 1 |
| Ian Barrett | – | – | – | – | – | – |
| Totals | 31 | 7 | 9 | 6 | 4 | 9 |
Batting2B: Conner Butler, Josh Prinzel, Jonny Wall
HR: Kyle Edwards
TB: Conner Butler 2, Ronaldo DelDuca, Kyle Edwards 4, Trent Jones, Patrick Lundblum, Garret Lyons, Ryan Peterson, Josh Prinzel 2, Jonny Wall 2
RBI: Conner Butler, Kyle Edwards, Garret Lyons 2, Josh Prinzel 2
ROE: Trent Jones, Bryce Jones
SB: Conner Butler
CS: Garret Lyons
TotalsTeam QAB: 18 (51.43%)
Conner Butler, Ronaldo DelDuca 2, Kyle Edwards 3, Bryce Jones, Patrick Lundblum, Garret Lyons 3, Ryan Peterson 2, Josh Prinzel, Jonny Wall, Wyatt Yates 3
Team LOB: 7FieldingE: Kyle Edwards, Garret Lyons
Knightsmore stats
| Lineup | AB | R | H | RBI | BB | SO |
|---|---|---|---|---|---|---|
| John Bastiaans | 2 | 1 | 0 | 0 | 2 | 1 |
| Phillip Woodard | 3 | 0 | 0 | 0 | 0 | 1 |
| Lincoln Lubsen | 3 | 0 | 0 | 0 | 0 | 3 |
| Chase Brimmer | 2 | 0 | 0 | 0 | 0 | 1 |
| Gordon Richardson | 1 | 0 | 0 | 0 | 0 | 1 |
| Nick Arnold | 3 | 0 | 0 | 0 | 0 | 0 |
| Ben Brombacher | 0 | 0 | 0 | 0 | 2 | 0 |
| Matt Phoebus | 1 | 0 | 1 | 0 | 0 | 0 |
| Sparky Bannon | 2 | 0 | 0 | 0 | 1 | 0 |
| Jeremy Harmon | 2 | 0 | 0 | 0 | 1 | 2 |
| Wes Bonney | 1 | 0 | 0 | 0 | 1 | 0 |
| Zach Updike | 1 | 0 | 0 | 0 | 0 | 1 |
| Jacob Lopez | 2 | 0 | 0 | 0 | 0 | 0 |
| Brandon Parks | 1 | 0 | 0 | 0 | 0 | 0 |
| Jason Covaney | – | – | – | – | – | – |
| Totals | 24 | 1 | 1 | 0 | 7 | 10 |
BattingTB: Matt Phoebus
ROE: Sparky Bannon, Chase Brimmer
FC: Jacob Lopez
SB: John Bastiaans 2
CS: John Bastiaans
TotalsTeam QAB: 16 (51.61%)
Sparky Bannon, John Bastiaans 2, Wes Bonney 2, Ben Brombacher 2, Jeremy Harmon 2, Jacob Lopez, Lincoln Lubsen 2, Matt Phoebus, Zach Updike, Phillip Woodard 2
Team LOB: 9FieldingE: Nick Arnold, John Bastiaans, Wes Bonney, Chase Brimmer
Drillers Bluemore stats
| Pitching | IP | #P | S% | H | R | ER | SO | BB | HR |
|---|---|---|---|---|---|---|---|---|---|
| Ian Barrett | 1.2 | 45 | .511 | 0 | 0 | 0 | 3 | 4 | 0 |
| Nicholas Jazkowski | 1.1 | 41 | .610 | 0 | 1 | 0 | 1 | 1 | 0 |
| Josh Prinzel | 3.0 | 47 | .617 | 1 | 0 | 0 | 4 | 2 | 0 |
| Kyle Edwards | 1.0 | 14 | .571 | 0 | 0 | 0 | 2 | 0 | 0 |
| Totals | 7.0 | 147 | .578 | 1 | 1 | 0 | 10 | 7 | 0 |
PitchingW: Josh Prinzel
WP: Nicholas Jazkowski
Pitches-Strikes: Ian Barrett 45-23, Kyle Edwards 14-8, Nicholas Jazkowski 41-25, Josh Prinzel 47-29
Groundouts-Flyouts: Ian Barrett 0-1, Kyle Edwards 0-1, Nicholas Jazkowski 2-2, Josh Prinzel 0-4
First pitch strikes-Batters faced: Ian Barrett 3-8, Kyle Edwards 1-3, Nicholas Jazkowski 1-7, Josh Prinzel 9-13
Knightsmore stats
| Pitching | IP | #P | S% | H | R | ER | SO | BB | HR |
|---|---|---|---|---|---|---|---|---|---|
| Jason Covaney | 5.2 | 108 | .630 | 7 | 4 | 3 | 9 | 3 | 1 |
| Chase Brimmer | 1.1 | 22 | .591 | 2 | 3 | 0 | 0 | 1 | 0 |
| Totals | 7.0 | 130 | .623 | 9 | 7 | 3 | 9 | 4 | 1 |
PitchingL: Jason Covaney
Pitches-Strikes: Chase Brimmer 22-13, Jason Covaney 108-68
Groundouts-Flyouts: Chase Brimmer 2-2, Jason Covaney 2-5
First pitch strikes-Batters faced: Chase Brimmer 5-8, Jason Covaney 17-27
Key
- AB: At bats
- R: Runs scored
- H: Hits
- RBI: Runs batted in
- BB: Base on balls (walks)
- SO: Strikeouts
- 2B: Doubles
- 3B: Triples
- HR: Home runs
- Grand slam: Grand slam home runs
- TB: Total bases
- RBI: Runs batted in
- SAC: Sacrifice hits & bunts
- SF: Sacrifice flies
- ROE: Reached on error
- FC: Hit into fielder’s choice
- HBP: Hit by pitch
- CI: Batter advances on catcher’s interference
- GIDP: Hit into double play
- GITP: Hit into triple play
- SB: Stolen bases
- CS: Caught stealing
- PIK: Picked off
- QAB: Quality at bats (any one of: 3 pitches after 2 strikes, 6+ pitch ABs, XBH, HHB, BB, SAC Bunt, SAC Fly)
- QAB%: Quality at bats per plate appearance
- LOB: Runners left on base at the end of an inning
- E: Errors
- DP: Double Plays
- TP: Triple Plays
- IP: Innings Pitched
- #P: Total pitches
- S%: Strike percentage
- H: Hits allowed
- R: Runs allowed
- ER: Earned runs allowed
- SO: Strikeouts
- BB: Base on balls (walks)
- HR: Home runs allowed
- W: Wins
- L: Losses
- SV: Saves
- BS: Blown saves
- HBP: Hit batters
- WP: Wild pitches
- BK: Balks